


Data analysis is a key component of a successful chargeback management strategy.
With data, you can make educated, informed decisions. Without data, you are left with hunches and guesses. You don’t know why disputes happen, how to effectively stop them, or if you’ve solved the problem.
Let’s take a look at how to use data analysis to prevent chargebacks and disputes.
How does data analysis prevent chargebacks?
Each chargeback you receive provides a ton of useful information. If you analyze that information, you can gain valuable insights — like the reason the cardholder chose to dispute the transaction. Then, you can use those insights to solve problems at their source — which, in turn, prevents future chargebacks from happening.
When it comes to creating and managing a chargeback prevention strategy, you basically have two options: a strategy with data analysis or a strategy without. Here’s what each looks like.
WITHOUT DATA ANALYSIS
WITH DATA ANALYSIS
- Based on guesses and assumptions
- Capable of producing short-term results
- Reactive
- Spend money on solutions you don’t need
- Based on educated, data-driven decisions
- Capable of producing long-term results
- Proactive
- Optimise ROI
WITHOUT DATA ANALYSIS
- Based on guesses and assumptions
- Capable of producing short-term results
- Reactive
- Spend money on solutions you don’t need
WITH DATA ANALYSIS
- Based on educated, data-driven decisions
- Capable of producing long-term results
- Proactive
- Optimise ROI
HOW IT WORKS
How do I prevent chargebacks with data?
Data analysis can be a powerful chargeback management tool — but it can also be confusing and difficult to manage without any assistance.
Here’s a step-by-step guide on how to collect and analyse your data.
STEP 1
Create a calendar.
Before you start doing the actual analysis, you’ll need to complete a couple of administrative tasks to get the data ready.
Start by creating a calendar. How often will you review your data? Daily? Weekly? Monthly?
And who will be responsible for collecting and reviewing the data?
Make sure responsibilities and expectations are clearly outlined so you don’t miss valuable opportunities.
STEP 2
Collect and consolidate your data.
There are a lot of data elements you’ll want to collect. The more data you have, the more comprehensive your analysis will be.
Here’s a list of data elements we suggest you gather for each chargeback you receive.
- The card brand (Mastercard, Visa, etc.) that filed the chargeback
- The merchant account ID (MID) used to process the disputed transaction
- The chargeback amount (which may be different from the original transaction amount)
- The chargeback reason code
- The marketing campaign that generated the disputed purchase
- The cardholder’s country
- The issuer’s bank identification number (BIN), the first 6 to 8 digits of the account number
- The product name or stock keeping unit (SKU)
- The date the chargeback was filed
Your data is probably spread out across several different platforms. Here are some places you will probably need to check and the data you’ll want to collect from each.
- Your shopping cart or order management system will have information like which item was purchased, whether or not the order was the result of a marketing campaign, and where the purchase was made.
- Your merchant account portal will have your transaction and chargeback data.
- Your prevention solution provider portal will have your prevention case data like Ethoca alert outcomes and RDR counts.
Once you have all your data, you’ll want to consolidate it — probably in a platform like Excel or Google Sheets — so you can cross reference different variables.
If you use a solution provider like AltoPay, some or all of this information will already be gathered and consolidated for you. Click here to learn more about our data analysis capabilities.
Your reporting will look like this.
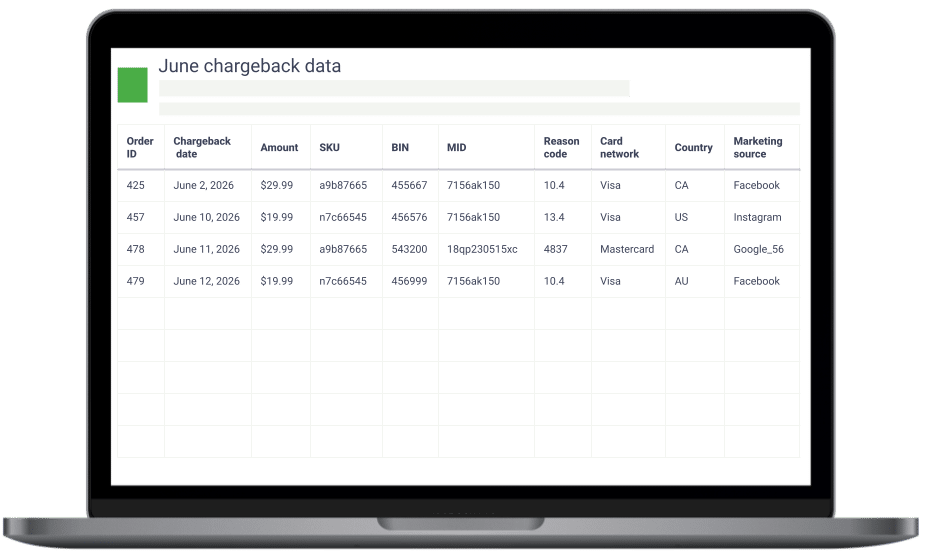
If you use prevention solutions — like prevention alerts and RDR — you’ll want to repeat this process with your prevention data. Note the same variables for each prevention case — card brand, merchant account, amount, marketing source, country, BIN, product type, and date.
STEP 3
Calculate and chart your data.
Once you’ve collected all your information, you’ll have about a dozen data elements for each chargeback.
Your data alone probably won’t tell you much. You need to analyse it in context to start gaining insights.
NOTE
We think the best metric for viewing data in context is your chargeback-to-transaction ratio.
For example, maybe 2% of your Visa transactions become chargebacks, but only 1.5% of your Mastercard transactions are disputed. Or 5% of transactions at the $15 price point are disputed, but only 2% of transactions priced at $8 become chargebacks.
Your chargeback-to-transaction ratio is a multi-variable analysis. If you analyse just a single variable without context, you are bound to make inaccurate or incomplete assumptions.
For example, maybe you look at the percent of chargebacks per marketing source. Marketing Campaign A might have caused 50% of your chargebacks. So you might be tempted to turn it off and focus on your other campaigns instead. But if you dig deeper, you realize Marketing Campaign A also brought in 75% of your sales — and had a mere 1% chargeback-to-transaction ratio. Marketing Campaign B seemed safer because it only caused 10% of your chargebacks — but it also brought it considerably less sales. So your chargeback-to-transaction ratio for Campaign B was 3.5%.
Turning off the seemingly risky campaign wouldn’t actually solve your problem — but it would cause you to lose a significant amount of good sales.
While the chargeback-to-transaction ratio is best for most variables, there are a couple situations where it isn’t applicable. For example, reason codes. For reason codes, you’ll want to just look at the percentage for each code.
Bottom line: If you can calculate the chargeback-to-transaction ratio for a given variable, do it!
Break down your data by different variables — marketing source, country, price point, etc. — and then calculate your chargeback-to-transaction ratio for each associated element. For example, the chargeback-to-transaction ratio for Canada, U.S., and Australia.
Usually, tables of numbers aren’t super easy to review. Charts, on the other hand, are more visual, making it easy to spot issues at a glance.
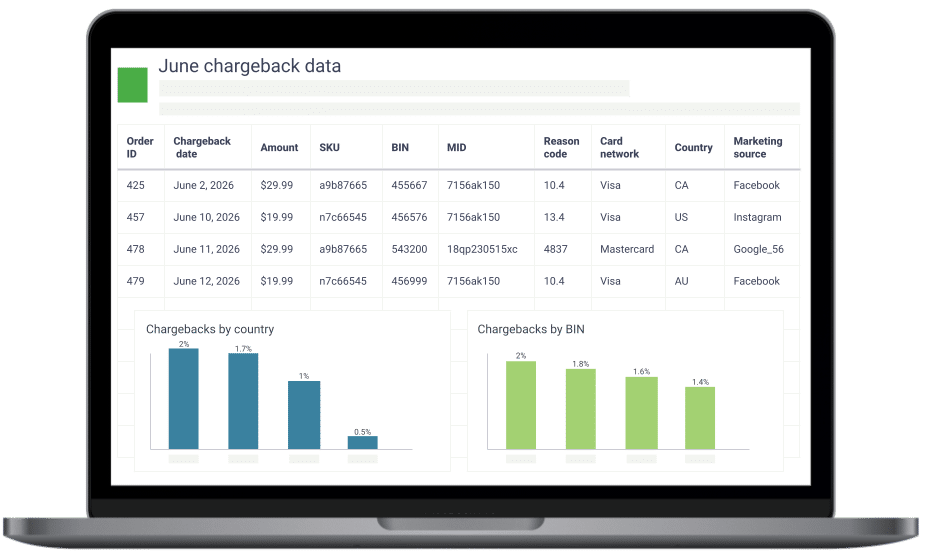
Ideally, you’ll get as granular with your analysis as possible. For example, break down all your data by MID, processor, and/or card brand.
If you use prevention solutions, you’ll want to repeat this process for your prevention case data.
STEP 4
Analyse your data and draw conclusions.
Here’s where all your hard work starts to pay off!
You have your data. You’ve extracted it from your different platforms and consolidated it. You’ve broken it down by different variables. And you have lots and lots of pretty charts.
But what does it all mean?!
As you regularly analyze your data, you’ll start to see norms and patterns for your business. You’ll also detect anomalies and situations that differ from the norms — signs that there are issues that need to be resolved.
Here are some examples of pattern anomalies and what they could mean for your business.
- A high chargeback ratio for low-value items could mean criminals are running cards (making test purchases to see if stolen payment information is still valid).
- High-value items might be enticing criminals because of their resale value.
- Customers might be filing chargebacks if certain items have a ‘no refund’ policy — like customized merchandise.
- Your merchandise might be lower quality than you expected.
- Issuers might auto-chargeback transactions if you are repeatedly making processing errors.
- Auto-chargebacks might happen if your business has a bad reputation or banks think your practices are fraudulent.
- A data breach at a bank might cause an influx of chargebacks from a single BIN.
- If you are automatically adding dynamic currency conversion to orders instead of letting customers opt-into the service, you might see an increase in chargebacks.
- Region-specific preferences might mean certain products are inappropriate.
- Expectations for size or material might vary by region.
- Your billing model might not be popular in a particular region, especially if you offer something like free trials or subscriptions.
- Chargebacks labeled as ‘canceled recurring billing’ could mean your billing model and policies aren’t clear.
- Your support team might not be handling refunds properly if you have lots of ‘credit not processed’ chargebacks.
- If you receive an influx in ‘unauthorized transactions’ chargebacks, you might need to adjust your fraud detection strategy.
- Your product descriptions and ads might be misleading, inaccurate, or incomplete if you get a lot of ‘not as described’ chargebacks.
- A spike in ‘merchandise not received’ chargebacks could indicate your delivery methods aren’t quick enough, your inventory is not able to keep up with demand, or your fulfilment team is short staffed.
STEP 5
Update your policies and procedures.
Once you understand what your data means, it is time to adjust your policies and procedures to solve the issues you’ve uncovered.
If you make updates but chargeback activity remains abnormal, you probably have other issues that need to be addressed.
Want better chargeback data?
An abundance of accurate, helpful data is the foundation of an effective chargeback management strategy. If you don’t have access to the data you need, it might be time to work with a different solution provider.
Reach out to AltoPay if you are interested in creating a more data-driven chargeback strategy.
AUTHOR
Jessica Velasco
For more than a decade, Jessica Velasco has been a thought leader in the payments industry. She aims to provide readers with valuable, easy-to-understand resources.